
Automated GC data profiling software
Chromatograms from any gas chromatography instrument are interpreted by our proprietary automated volatile organic compound fingerprinting pipeline — from raw signal to a trained classification model, with no manual peak picking.
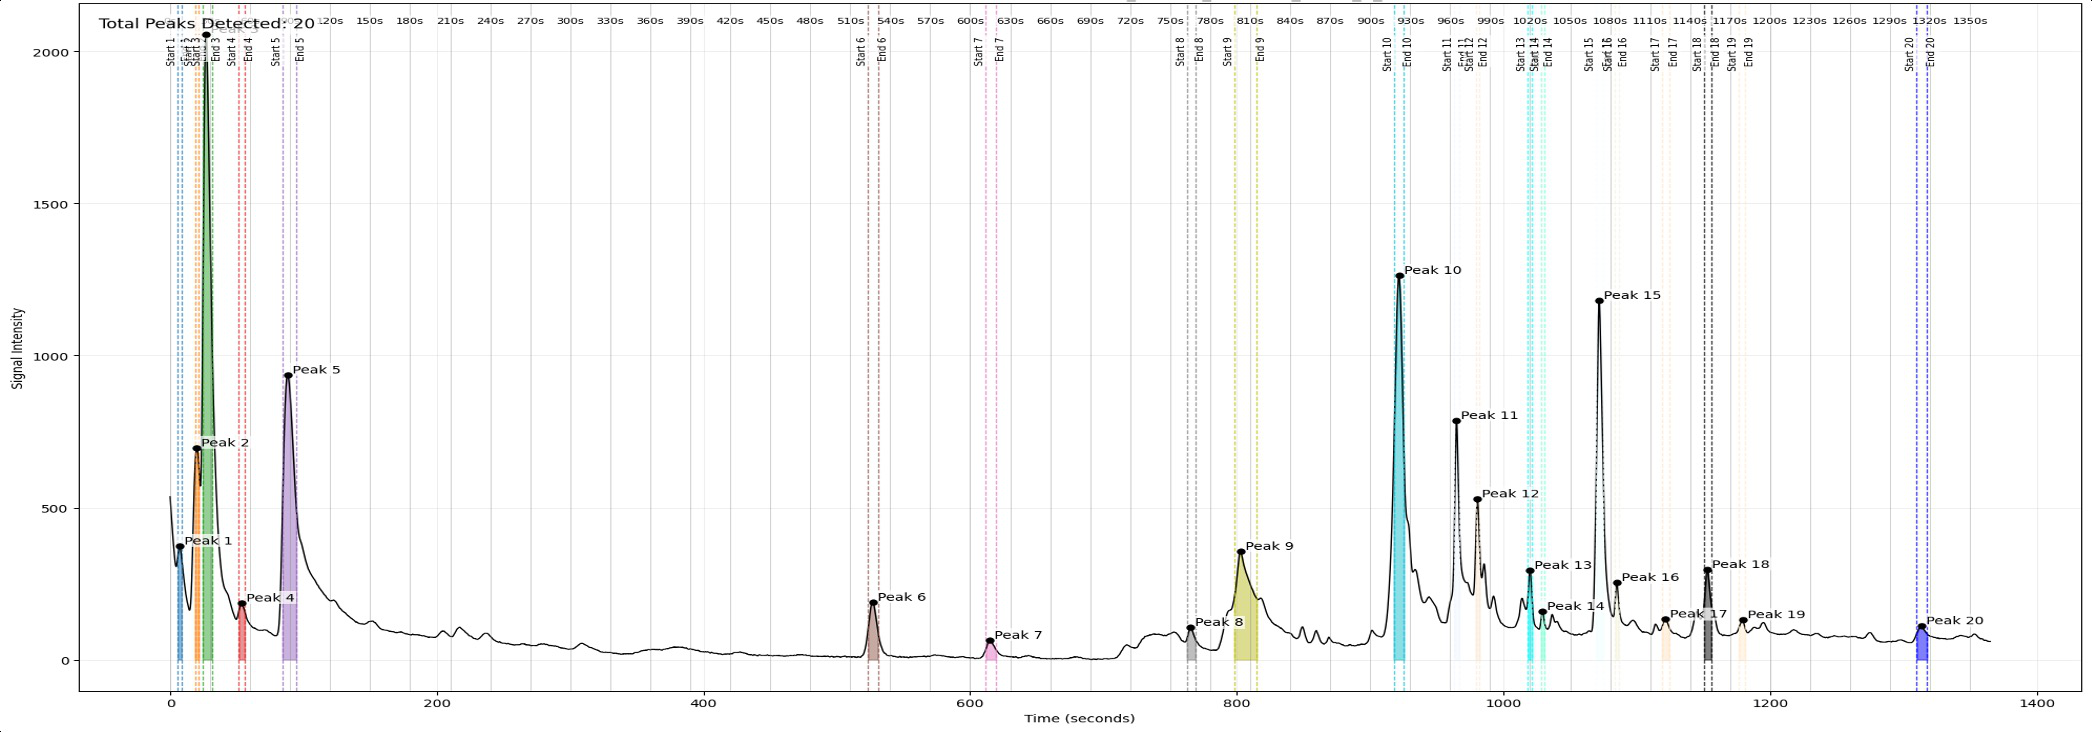
Gas chromatography data is only as useful as the analysis behind it. Traditionally, turning raw chromatograms into answers means hours of manual peak integration and expert interpretation for every batch of samples — whatever instrument produced them. Our software is instrument-agnostic: it integrates with the gas chromatography hardware you already run, or connects to our own gas chromatograph Scout3, and automates the entire analysis workflow: it cleans the signal, detects and fits every peak, clusters and identifies peaks across samples, maps them to compounds, benchmarks five proprietary normalisation algorithms, and trains and evaluates classification models — all in one repeatable pipeline.
The pipeline: from instrument to trained model
- 1Ingestion of raw GC data from other instruments or direct connection to Scout3 chromatograph. Custom connectors can be set up.
- 2Select samples
- 3Load chromatograms
- 4Smooth chromatograms
- 5Remove baseline
- 6Process sub-baselines
- 7Detect peaks
- 8Fit peaks
- 9Cluster peaks
- 10Identify peaks
- 11Identify compounds
- 12Normalisation algorithm 1
- 13Normalisation algorithm 2
- 14Normalisation algorithm 3
- 15Normalisation algorithm 4
- 16Normalisation algorithm 5
- 17Select peaks
- 18Prepare training data
- 19Model training & evaluation
Case study: telling healthy plants from infested ones
Detecting a pest infestation early is one of the hardest problems in crop protection — by the time damage is visible, the infestation has usually spread. Plants under attack change the mix of volatile organic compounds they emit, so the signature of an infestation is present in the air around them long before it is visible to the eye. The challenge is reading it reliably.
Our software was used across four separate data collection campaigns run at European research institutes during 2025-26, covering several pest and crop combinations. The same pipeline ingested data from three different instruments — a rack-mounted gas chromatograph with photoionisation detector, a portable GC-PID prototype, and a proton-transfer-reaction mass spectrometer (PTR-MS) used as a high-end reference — and in each case trained a classifier to label a sample as healthy or infested.
- 91%highest differentiation accuracy achieved using gas chromatography data
- 41smallest dataset, in samples, where over 90% classification performance was achieved
Classification accuracy reported as mean F1 score under five-fold cross-validation, repeated ten times with different random splits.
Untargeted beat targeted
The strongest results came from our fingerprinting approach — scanning every peak in the chromatogram and letting the model decide what matters — rather than the conventional method of tracking a handful of known marker compounds. The peaks that proved most informative differed from one plant-pest combination to the next, which is precisely why a fixed, hand-picked marker list struggles where an untargeted scan succeeds.
This work was carried out within PurPest, a project funded by the European Union's Horizon Europe research and innovation programme under grant agreement No. 101060634.